How to reduce RMM alert noise as an MSP
TL;DR
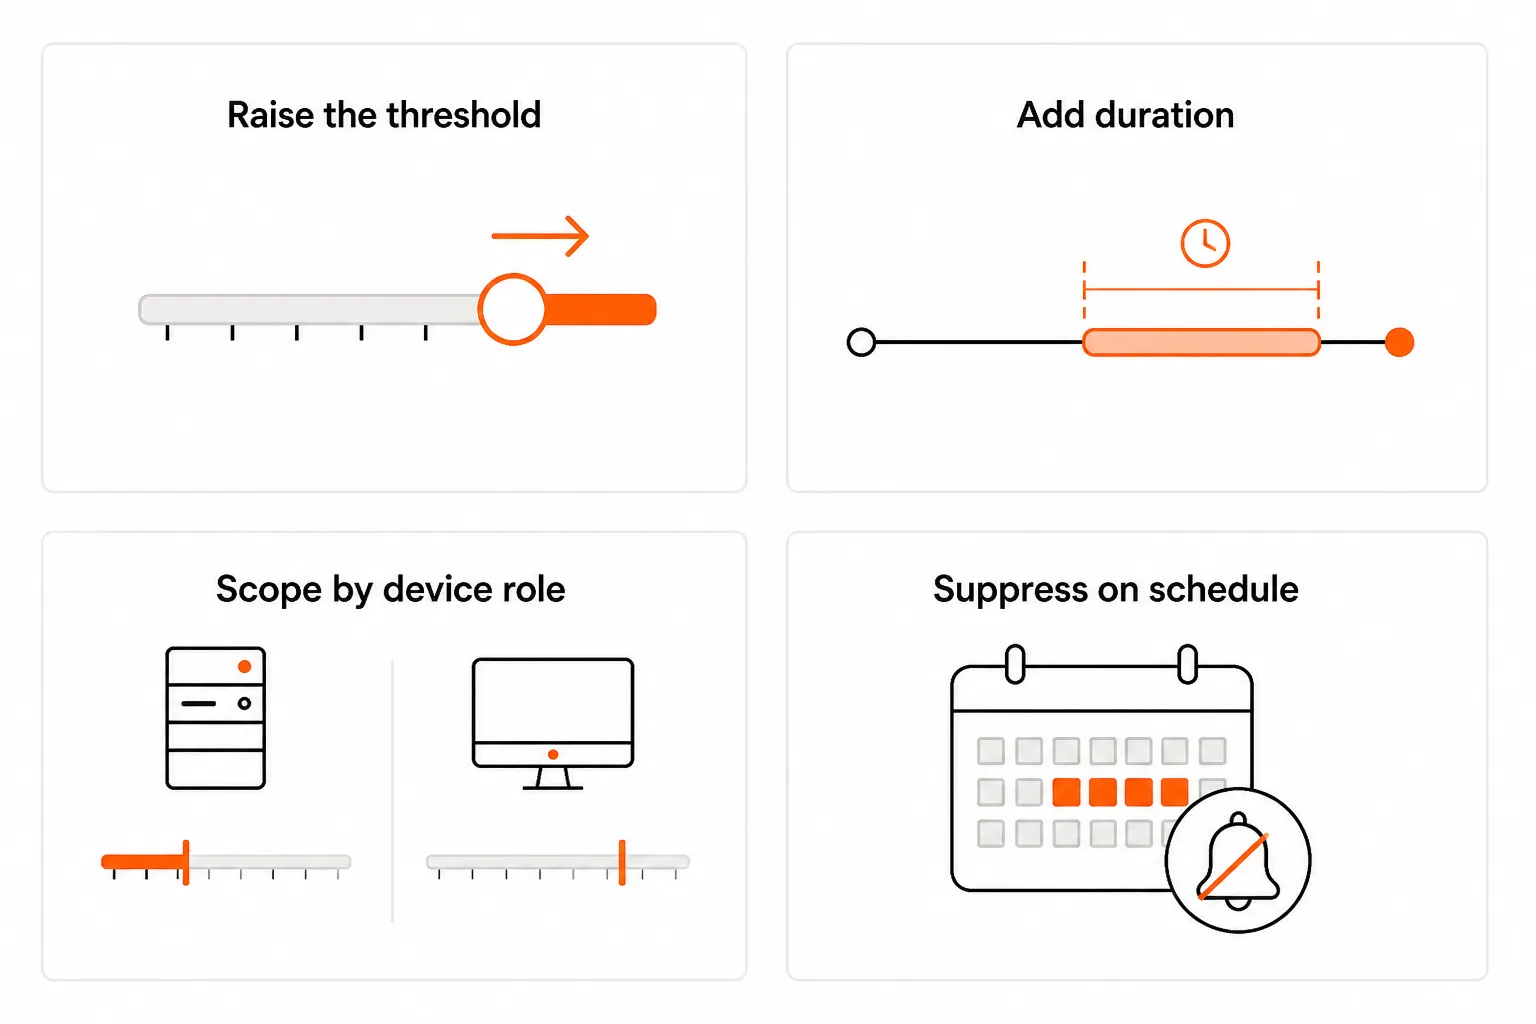
RMM alert noise is a configuration problem, not a monitoring problem. Your platform isn't broken - it's set to defaults designed for every MSP, which means it's wrong for yours. The fix follows a predictable sequence: audit your 30-day alert history to find the 10-15 monitors causing most of the volume, then apply four moves - raise thresholds where defaults are wrong, add duration filters to kill transient spikes, scope monitors by device role, and suppress during known maintenance windows. That gets you to signal. What you do with the surviving alerts - the ones that become tickets - is a separate problem that automation can solve.
Why your RMM is buried in noise
Walk into any MSP's ops room and you'll find technicians who've stopped looking at their RMM dashboard. Not because they don't care, but because they've been burned too many times. Every alert that fired and resolved itself taught them that alerts are probably not real. That's the actual damage: when technicians stop trusting RMM alerts, the entire monitoring process starts to feel like a waste of time.
The numbers reflect it. 56% of large companies handle more than 1,000 security alerts per day, and that's just security alerts - not disk, CPU, backup, or network. For an MSP managing dozens of clients, the daily alert count can easily reach into the thousands. Most of those alerts are transient spikes that fix themselves before anyone looks. The technician learns to ignore them, which is rational - until the one real incident they shouldn't have ignored gets buried in the queue.
The business consequences run deeper than missed alerts. IT staffers who are continuously overwhelmed may choose to leave. And on the client side, alert fatigue is quietly costing MSPs their clients - a constant stream of notifications trains clients to treat alerts as noise, which damages the perceived value of the whole relationship.
The root causes are structural:
- Factory defaults don't match your workload. RMM systems ship with defaults designed to be safe for everyone, which means they are wrong for you. A disk at 80% might be fine on a server that's run at 84% for three years.
- No duration filters. A single CPU spike to 95% for two seconds fires the same alert as a sustained spike lasting 20 minutes. They are not the same thing.
- One-size-fits-all configs. Different clients and device types need different thresholds. A terminal server runs differently than a batch server.
- Redundant monitoring tools. Overlapping tools create duplicate alerts for the same event.
None of this is the RMM's fault. It's configuration debt, and it's fixable.
Step one: count before you tune
The temptation is to start tuning immediately. Don't. The tempting metric is total alert count, but on its own it is misleading - you can always get to zero by turning everything off.
Before touching a single threshold, pull 30 days of alert history and group it by three dimensions:
- Volume - how many times did each monitor fire?
- Actionability - how many of those fires led to any change (a ticket opened, a human intervention, a fix deployed)?
- Client spread - is this one noisy client or a systemic problem across the estate?
What you'll find, almost every time, is that 10-15 monitors generate the large majority of total volume. This is the Pareto principle at work. Fix those first. Ignore the long tail for now - the volume it represents is small, and tuning it before the big offenders wastes time.
The monitors you're looking for are the ones with high volume and near-zero actionability. "CPU threshold exceeded" fires 200 times in 30 days and led to a human action twice? That's your first target.
The four moves that cut 80% of volume
Once you know which monitors are generating the noise, you have four tools for cutting it. Apply them in roughly this order of preference.
Raise the threshold
The blunt instrument. Use it when the default is simply wrong for the workload. A disk at 80% on a server that has run at 84% for three years should not alert. Raise the threshold to 90%, document why, move on.
The risk with threshold-only tuning is that you're playing whack-a-mole - every client's workload is slightly different, so you end up with dozens of per-device overrides that become impossible to maintain. It's a start, not a strategy.
Add duration (this is the one)
Far better than raising thresholds and consistently underused. Instead of alerting the moment CPU crosses 90%, require it to stay above 90% for 10-15 minutes first.
The underlying logic: most spikes are transient. A process burps, hits 95% for 45 seconds, falls back. That's not a problem worth a ticket. "CPU above 90% for 15 minutes" is a problem worth a ticket. This single change removes enormous volume while keeping every real event.
NinjaOne lets you create a condition that only triggers when a threshold is met over a specific duration - for example, when Aggregate CPU Usage is greater than or equal to 90% for 5 minutes. Datto RMM and ConnectWise Automate have equivalent duration windows. The setting exists; most MSPs just never configure it.
Scope by device role
The same threshold rarely suits a terminal server and a batch server. A terminal server with 50 concurrent users will run at 70% CPU constantly; a batch server that idles at 10% and spikes to 95% during nightly jobs has a completely different profile.
Splitting monitors by device role is more upfront work - you need to classify devices and build separate policy templates - but it produces the most durable reduction over time. When you onboard a new client, you apply the right template and it works, rather than inheriting noisy defaults you'll have to tune per device.
NinjaOne's policy inheritance model makes this straightforward: tune at the policy level, override per device only as an exception, and audit those exceptions quarterly. ConnectWise Automate uses internal monitor sets per group - build the role-based groups first or you'll edit the same monitor repeatedly.
Suppress on a schedule
Backup windows, patch deployment windows, known batch jobs - these all generate legitimate load that shouldn't alert at 2 AM. Suppression is safe when it's tied to a window and dangerous when it's permanent.
Configure your RMM to hold non-critical alerts overnight and deliver them as a morning digest. Implement "Quiet Hours" for low-urgency alerts outside of business hours. This doesn't mean turning off monitoring - it means batching low-priority notifications when nobody's on-call to action them anyway.
Datto RMM's component-level policies make duration windows the highest-return setting here. Kaseya VSA's counter thresholds are granular - the risk is fragmentation, so document your standard before you start customizing.
Alerts you should never silence
Before going further: some monitors should stay loud no matter how much noise they generate. The cost of missing one of these outweighs any volume reduction benefit.
- Backup job failures - including "completed with warnings"
- RAID or storage degradation
- Domain controller replication failures
- Certificate expiry inside 30 days
- AV or EDR disabled on any endpoint
- Any monitor that has fired for a genuine P1 incident in the last 12 months
If you're not sure whether a monitor belongs on this list, ask yourself: if this fires and nobody acts on it for 24 hours, what's the worst-case outcome? Backup failures and DC replication issues can snowball into catastrophic data loss within hours. Those stay loud.
Build a severity tier - and route accordingly
Once you've cut the noise, the alerts that remain need to mean something. If everything that survives is labelled "Critical," nothing is critical.
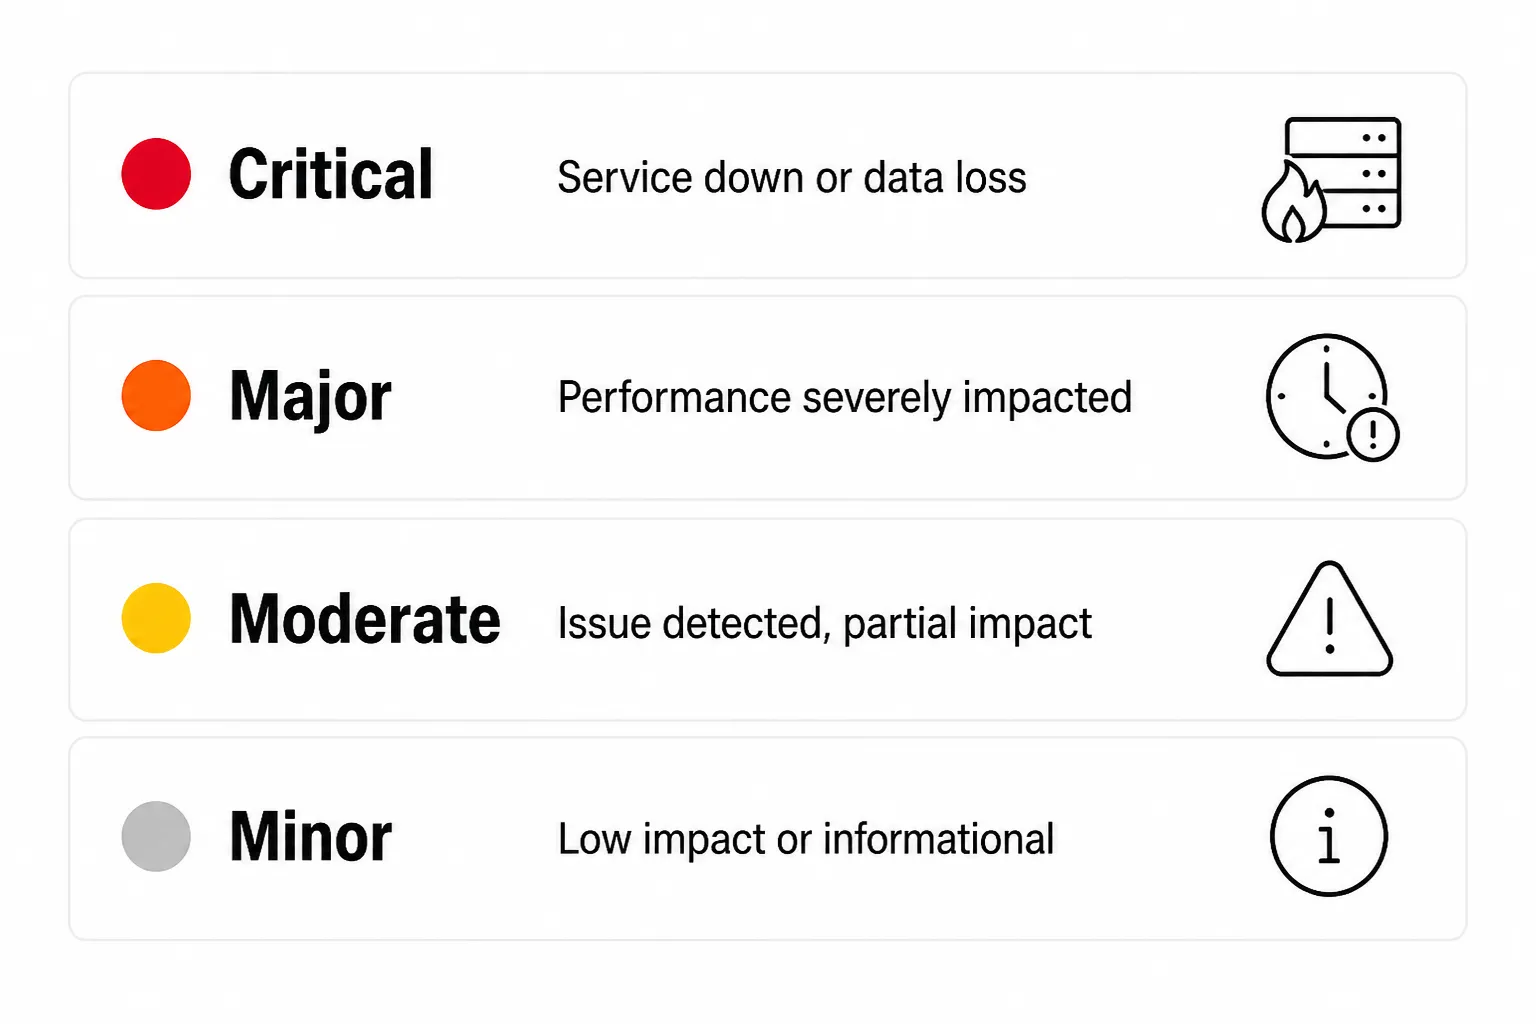
NinjaOne recommends a four-tier model:
- Critical - severe threat to system integrity or business operations; requires immediate response
- Major - high impact, affecting significant systems; needs action within the SLA window
- Moderate - limited impact; can be batched and reviewed during business hours
- Minor - informational; deliver as a digest, not real-time
Not all clients need the same level of monitoring. A basic plan might receive Critical alerts only; a premium client might get Warnings and a scheduled weekly digest. Align alert policies with service contracts - it sets the right expectations and stops clients from treating every minor notification as a five-alarm fire.
The other half of routing is making sure alerts reach the right person. A bandwidth alert goes to a network engineer; a security warning to a security specialist. Even well-tuned alerts become useless if they land in a shared inbox where nobody owns them.
"The classic failure: an alert fired, a ticket got created, sat unassigned, and the issue that could have been caught early turned into a P1 six hours later. The alert wasn't the problem - the routing was."
Every alert that isn't acknowledged within a defined window should automatically escalate to another team member. This is the escalation path most MSPs skip, and it's where critical alerts die quietly.
The problem nobody talks about: what survives becomes tickets
Here's the part that most alert noise guides don't address. You've done the tuning. Your monitors are well-configured. The alerts that fire now are real. And they're still creating tickets.
A disk is genuinely full. A user is genuinely locked out. A patch deployment genuinely failed. These aren't noise - they're real issues that need resolution. And every one of them lands in the PSA as a ticket that a technician has to open, read, diagnose, and fix.
For most MSPs, the majority of those tickets are L1: password resets, account unlocks, software installs, access requests. Password resets alone account for ~18% of L1 ticket volume across MSPs. Each one takes a human 5-15 minutes to handle - find the user, navigate the identity provider, reset the credential, email the user, update the ticket. Multiply that across 200-400 tickets a month and you're looking at 50-100 hours of technician time on work that follows the same script every time.
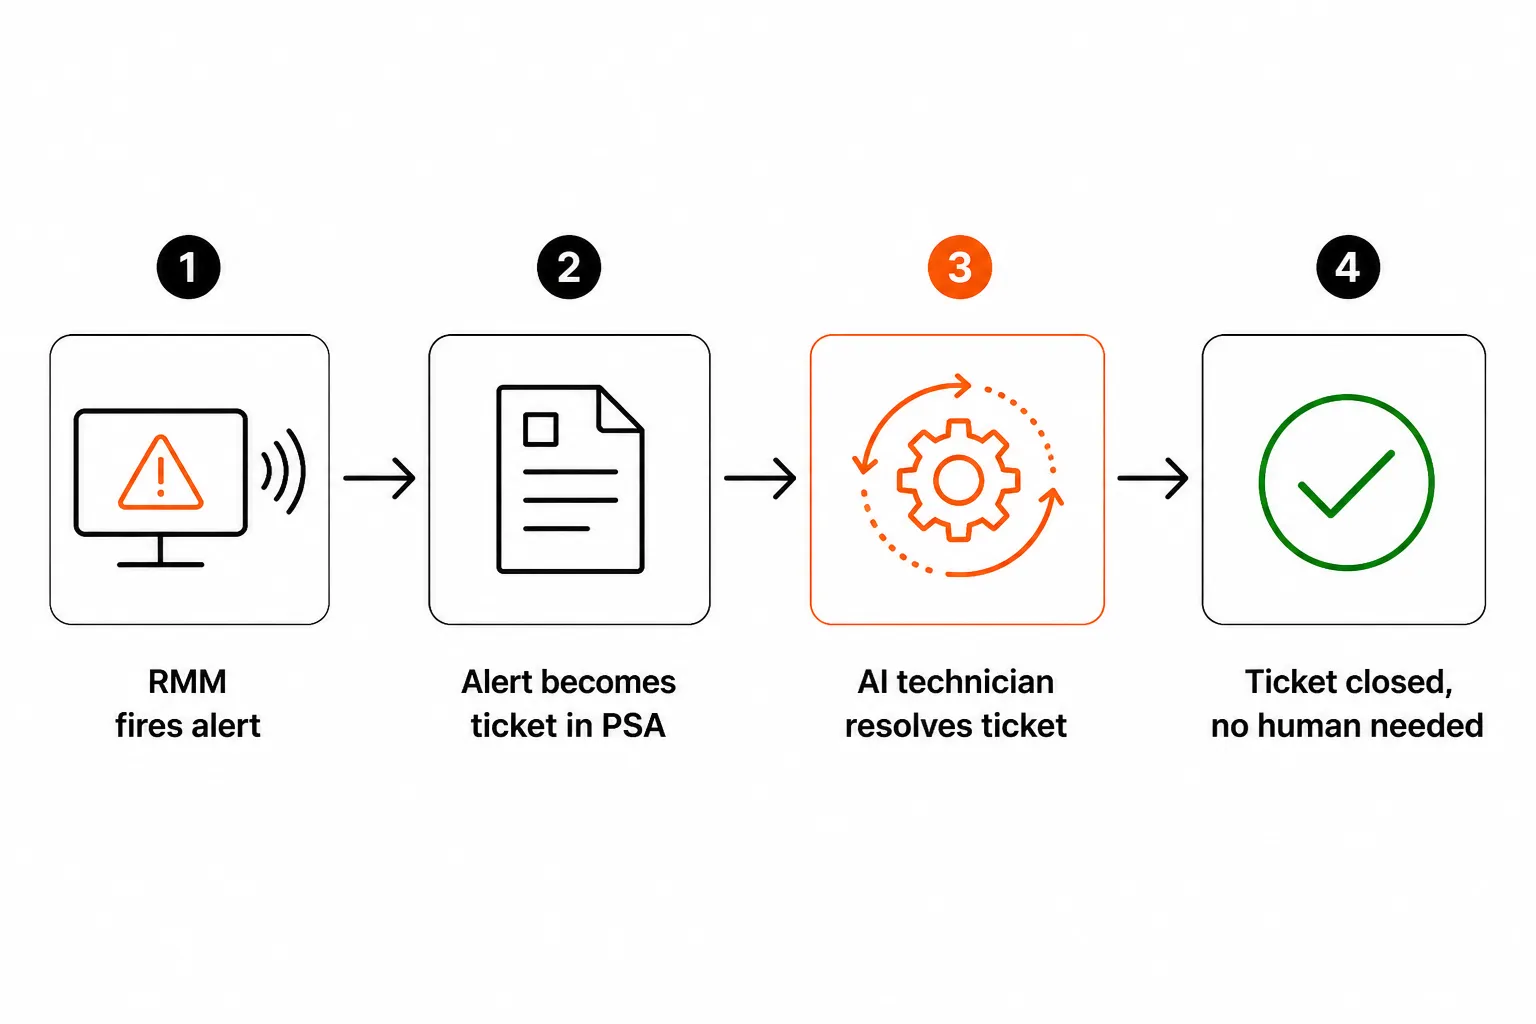
This is where automation picks up where alert tuning leaves off. Noise reduction gets the signal through; an AI technician handles what the signal generates. The two moves aren't in competition - they're sequential. Fix the configuration first; then automate the resolution layer.
Measuring success (and the one metric that will mislead you)
The obvious metric is total alert volume, and it will mislead you. You can always get to zero alerts by turning everything off. What you actually want to track is the alert-to-action ratio - the percentage of alerts that led to any kind of change.
Track these four metrics together:
| Metric | Direction after tuning |
|---|---|
| Alert volume | Should fall |
| Actionability rate | Should rise |
| Escalations per week | Should fall |
| Client-reported incidents | Must NOT rise |
That last one is the control. If client-reported incidents climb while your alert volume falls, you've tuned past the signal. You've accidentally suppressed something real. Pull back and find it.
For a typical MSP estate, the first tuning pass takes two to four weeks of part-time effort and removes the majority of noise. The long tail - fine-tuning after the initial pass - is quarterly maintenance, not a project. Schedule a 90-minute block every quarter to review the top-10 offenders, retire stale rules, and check that client-reported incidents haven't crept up.
Try Rallied
Rallied is an AI technician built for MSPs. Once your alert tuning is done and the real alerts are generating real tickets, Rallied handles the L1 layer: password resets, account unlocks, user provisioning, M365 access changes, and RMM-triggered script execution. It connects to your PSA, RMM, and identity stack - ConnectWise, Autotask, Halo, NinjaRMM, Datto, Entra ID, Okta, JumpCloud, M365 - and works the tickets the same way a human technician would, without the wait.
MSPs running Rallied recover 50-100 hours of L1 technician time per month, for $150 a month, about 700 tickets in a typical month. No 6-month implementation. No workflow builder overhead. Deploy it this week, start seeing results before the weekend.
For the wider picture, read Best MSP Software in 2026.
Frequently Asked Questions
What causes RMM alert noise in MSPs?
RMM platforms ship with defaults tuned to alert on everything, which means they are wrong for almost everyone. The root causes are: out-of-box thresholds that don't match real workloads, missing duration filters that let every transient spike fire, one-size-fits-all configs applied across very different device roles, and redundant alerts from overlapping monitoring tools. Most MSPs find just 10-15 monitors generate the bulk of their volume - a Pareto problem with a Pareto fix.
What's the single most effective thing I can do to reduce RMM alert noise?
Add duration thresholds. Instead of firing the moment CPU hits 90%, require it to stay above 90% for 10-15 minutes before alerting. According to NOC247's analysis, duration filtering is consistently underused and delivers the highest volume reduction of any single tuning move - because most spikes are transient and self-resolving. This one change can cut alert volume by half on a typical MSP estate.
How long does it take to tune RMM alert noise properly?
The first pass takes two to four weeks of part-time attention and removes the large majority of volume. The catch is that it doesn't stop there - estates change as you onboard new clients, deploy new device types, and add monitoring tools. Alert tuning is quarterly maintenance, not a one-time project. The good news: once the initial pass is done, quarterly reviews take a fraction of the time.
Which alerts should I never suppress, no matter how noisy?
Six categories should never be silenced: backup job failures (including 'completed with warnings'), RAID or storage degradation, domain controller replication failures, certificate expiry inside 30 days, AV or EDR disabled on any endpoint, and any monitor that has fired for a genuine P1 incident in the past 12 months. These are the alerts where the cost of missing one outweighs any noise reduction benefit. Keep them loud, always.
Can AI help reduce RMM alert noise for MSPs?
Yes - in two ways. The first is alert correlation and suppression: tools like Everkeel ingest your RMM alerts and use AI to group related events and suppress duplicates before they hit your queue. The second is automated ticket resolution: once an alert survives your filters and becomes a ticket, an AI technician like Rallied can resolve the resulting L1 work - password resets, account unlocks, software deploys - without a human touching it. The two approaches are complementary: noise reduction gets you to the signal; automation handles what the signal generates.